Read all about the T2L metric
Let's measure our business agility
What is T2L?
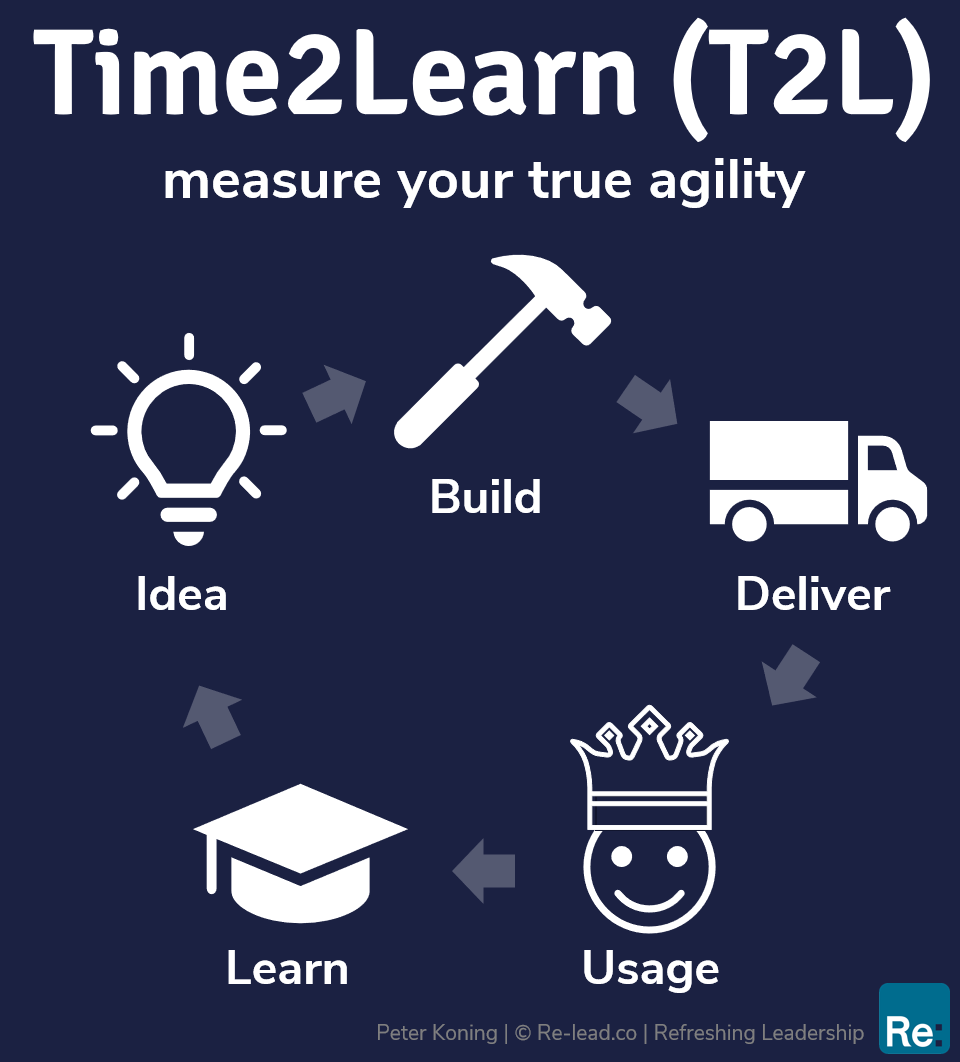
The T2L metric measures how quickly the teams can learn from actual users. It’s the time between the initial start of a changed or additional feature and the moment the team has learned from users. The shorter the T2L, the greater the learning speed.
Time to learn (T2L) is the latency between the start of build process and learning based on feedback from actual usage from customers. Put in other words: it’s the time between starting the development of new functionality, features or improvements including delivering or releasing it to customers and also the time it takes to gather enough data and feedback from actual users to learn and make choices accordingly.
Why a new metric
Over the past years I have been looking for a metric that could indicate the agility of an organization. After a study of the more common metrics used for products and management reports, I couldn’t really find a metric that indicates the level of agility. For example in the time-to-market metric I missed the feedback of the actual usage of the product or service. So for a few months I’ve worked to create this missing metric.
Why measure your business agility
The world is changing faster and faster. The speed of new development has never been this quick. Back in the 1900s it took 70 years before the telephone reached 50 million users. It took 35 years before the television reached 50 million users. And nowadays new apps reach 50 million users within a day.
How quickly can you respond to new market changes? How fast can you adapt?
To survive and beat competition, this is more important than ever before!
Do you have an example?
Let’s have a look at an example. In the beginning of January a team starts to refine, work out the first details and make the first implementation of a new feature. It’s deployed to customers in May. The gathering of usage data and customer feedback takes 3 months. At the end of September the lessons learned are presented, new ideas are added to the backlog, priorities are re-assessed and some existing Product Backlog Items are removed. The total T2L is 9 months: from beginning of January until the end of September. So in this example, the organization took 9 months to learn whether the feature brought any value.
- January - start refinement
- May - deploy to customers
- August - gathered usage statistics
- September - lessens learn
Total: 9 months = T2L.
Case: Insurance company
A big insurance company of over 5,000 employees wanted to develop a new generic offer functionality to boost sales. Currently different departments, like car-insurance, life-insurance and house-insurance all had their own offer-functionality. When a customer wanted to have multiple insurances, he/she had to fill in her personal details multiple times to get a quote.
After designing the first version of the offer functionality, the team sat down do make a success criteria. The developers wanted to measure the usage, the stakeholders wanted to measure the number of clicks (less) needed to apply for an offer. But the Product Owner emphasized on the customer value and wanted to learn if more customers really took an insurance.
After brainstorming on it, they created the following success criteria: Within 2 months after releasing the MVP, the number of offers should increase with 25% leading to at least 10% more sales
They where able to release a first MVP within 1,5 months, and sales didn't increase as much as expected. So they studied the data. An idea popped-up to make an offer with even less input fields, making it more easier for a customer to get a first quote. It took a few weeks to release the updated version and after that indeed the sales went op with more than 10%.
| Iteration | Start refinement | Released | Learned | T2L |
| 1 | February | April | May | 4 months |
| 2 | June | July | September | 4 months |
But how can I convince my stakeholders?
The T2L metric itself is a new metric, but the idea behind this metric is common sense. If your stakeholders just push you and your teams for more features or an higher velocity, you can use the following to trigger them:
- Good idea, how could we measure the success of this feature in the first weeks/months after releasing it to customers?
- During a sprint review, show also the usage statistics of the things built 3 months ago. If the results are unknown or insignificant, make a suggestion to learn faster from the things built in a sprint.
- When stakeholders want additional features before you ship it to customers, suggest a smaller target audience and emphasize that you want to learn from the things already built before you increase further costs.
3 benefits of an improved T2L
1. Upfront discussion on what we want to achieve
When the team routinely starts applying T2L, it’s more likely to be focused on what they really need to achieve as a team. They ask questions of the work such as: when is a feature successful? When 1.000 users use it daily? When the conversion on the website has increased by 5%? How are we going to measure success? When the team starts thinking about T2L it is often easier to focus on value with both the work undertaken and the solutions selected.
2. Focus on learning more, and not on doing more
Presenting this T2L during the sprint review often removes the focus on the velocity and the details of the planning. Of course how effective development is important, but only in the context of doing the right thing or delivering the right learning. When stakeholders get transparency on the outcome and impact of the features delivered several sprints ago, the mindset of the meeting shifts. It shifts more to long term goals based on value such as usage, market penetration and customer satisfaction. This often results in quicker experiments, learning from actual data and finding improvements more rapidly.
3. Faster learning is faster value
With a short T2L the organization can learn a lot faster on many fronts. The team starts to understand the customer demands better, because it sees if the new functionality or added features are used or not. The Product Owner learns what delivers actual value and what does not. With a long and slow learning loop, so much new functionality is added that it’s hard to deduce what actually improved it. With a short T2L, it’s much easier to know what led to the improvement and therefore what is of real value and what is not.
Additionally, the team gets quick feedback on the quality of their work so they know more quickly what to improve on their craftsmanship. Stakeholders also start to see which ideas were actually good ideas and what the customers really need.
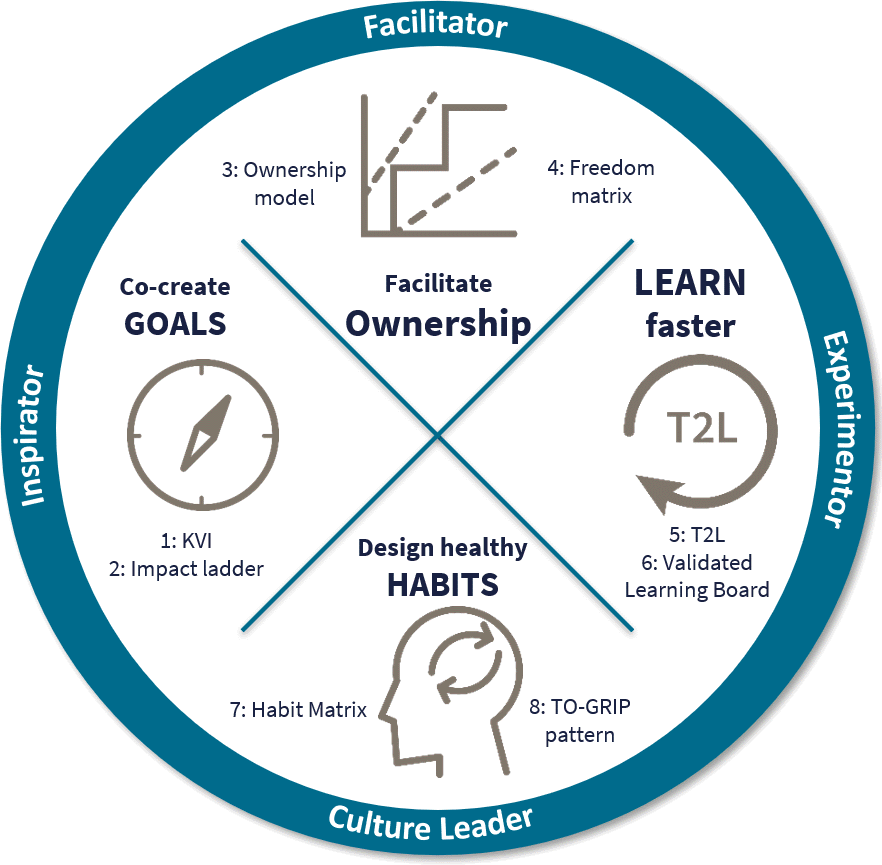
The toolkit
The steering wheel of the agile leader consists of four components. Each component consists of two practical tools. So in total eight tools. The tools are explained in such a way that leaders can immediately start working on this. The tools can be used separately and as such successful. Of course, all tools together – the toolkit – reinforce each other. It concerns the following eight tools:- KVI – the Key Value Indicator (KVI) is the most important indicator for value creation for the team.
- Impact ladder – for brainstorming and visualizing the customer impact. This helps teams continuously improve their products and services.
- Ownership model – visualizes what teams need to take ownership.
- Freedom matrix – what freedoms and responsibilities does the team have at what time.
- T2L – to measure the business agility.
- Validated Learning Board (VLB) – to visually keep track of the learning process of the team.
- Habit matrix – to support culture change and the design of new habits.
- TO-GRIP – to support the agile leader in implementing major improvements.