Key Value Indicator (KVI)
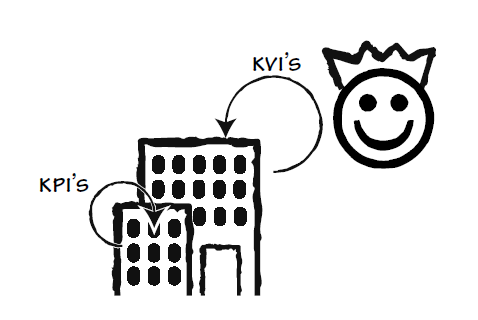
The Key Value Indicator increases the effectiveness of the teams. Delivering value to users and customers is the key purpose of agile working. Not working harder (writing more code, handling more phone calls) but working smarter by (preferably) doing less. But how do you increase the effectiveness and optimize value? By creating clarity on the relation between the positive customer impact and business value.
The KVI is the most important indicator for the team to find out whether they generate value. The KVI is (preferably) one number, visualized in a trend line, which makes the relationship between customer impact and value concrete for the company.
What is a KVI (Key Value Indicator)?
The focus of this tool is to serve customers smarter and better, thereby generating more value for the company. It is therefore not an internal goal that measures what the team does. The KVI is a current figure with which the team can measure the impact of their actions. Team members can independently consult and analyze the figures. Several teams that work together at the same value have the same KVI.
Examples of KVIs
- Conversion: the conversion (%) on the website. Of the 100 visitors, how many buys from them.
- Daily active users (DAU): the number of (millions of) users that use the app every day.
- Daily active minutes (DAM). the number (millions) of minutes that the app is used.
- Manual actions (MA): the number of manual actions that have to be carried out per week by the office staff because the software does not yet fully support this.
- Number of calls per week per 1,000 customers (CPkC). Number of times that 1000 customers call per week because the website is not very clear whether the self-service does not support everything yet.
Some advantages of using this tool
- It increases the focus on the user and the customers. This allows the teams to respond agile to the changes in the market.
- Because the teams know what ‘winning the match’ is for them, they can put their thinking power, creativity and focus on it. This makes the teams more successful.
- The agile leader gets a concrete metric to see how much value the teams deliver.
- The teams are less likely to be seen as a cost item but rather as an investment that generates money.
- It is motivating for the teams to see how their work contributes to the ambitions of the company.
Case: SME Sales department
A sales department of a railroad company was struggling with hitting the sales targets. They were responsible for selling subscriptions and package-deals to all the Small & Medium Enterprises in the Netherlands.
The tried different metrics, like:
- Number of phone calls per week - they saw a correlation between the number of phone calls and the number of closed deals, but ... having more phone calls didn't increase the sales enough
- Number of subscriptions per month - they measured the number of subscriptions sold per month. But selling to one larger company (with 1,000 employees) took often as much effort as selling to a smaller company (with 100 employees). Next, the money involved with these subscriptions where also quite different. Some subscriptions where only € 10,- a months, while other subscriptions where € 200,- a month.
- Monthly subscription value - they improved the metrics and tried to measure the monthly worth of subscriptions. So selling 10 subscriptions, with - on average - € 50,- per month, would result in € 500,- subscription value.
Challenges
But...
These are all relative traditional metrics... do they really measure the customer benefit? Or do they only measure the company value? Some of the things these metrics don't tell:
- Was the subscription given with such a discount, that the company would loose money with every customer?
- Did the customers actually use their subscription? Or was it very likely that the customer would cancel the subscription next month?
- Did it actually bring customer value? Did they really like the train and preferred it above their car, bike or other transportation?
Solution for this SME company
So what did work? How did the KVI help this company?
Based on brainstorm session and using the impact ladder they came up with two new metrics which they continuously monitor and improve
- Total monthly margin - They improved the data and are now able to calculate the (rough) margin per subscription. This margin is based on the expected revenue (minus the discount given). This is not only for the subscriptions sold last week, but for all the active subscriptions. So even those sold years ago but are still active
- NPS - Net Promotor Score - Every month they asked an a-select group of customers on their satisfaction. One of the most important questions is "How likely is it that you promote us?". Due to the amount of customers, they could ask a random group of people, with a good distribution between high and low margin subscriptions.
These metrics, including the data behind them, where studied continuously. Knowing better which customers to target, and how to optimize not only the satisfaction, but especially for the high margin subscriptions. Which also helped to focus all the improvement areas.
Resulting in: Optimizing the margin of the satisfied customers
Leader's responsibility
What is the responsibility of the agile leader? He/she is responsible that:
- the agile teams have a KVI.
- that the KVIs are aligned between the teams
- that outcome is more important than output (what the teams achieve is more important than how much work they do
- that the KVIs are aligned with the companies strategy
Product Owners responsibility
The Product Owner is responsible for:
- That the KVI aligns with the products vision
- That the team can invest in tracking and studying the underlying data
- Collaborating with the other Product Owners who also contribute to the KVI
- During Sprint Reviews, also update the stakeholders on the progress on the KVI
Relation to other tools
- See all the all the tools of the Agile Leadership Toolkit
- Is it hard to find the correlation between customer impact and company value? Use the Impact Ladder.
- Is it hard to have a pro-active, proud and engaged team that works on the KVI? Use the Ownership model
- Is it hard to get quick-enough feedback from users? Use the T2L metric.
The toolkit
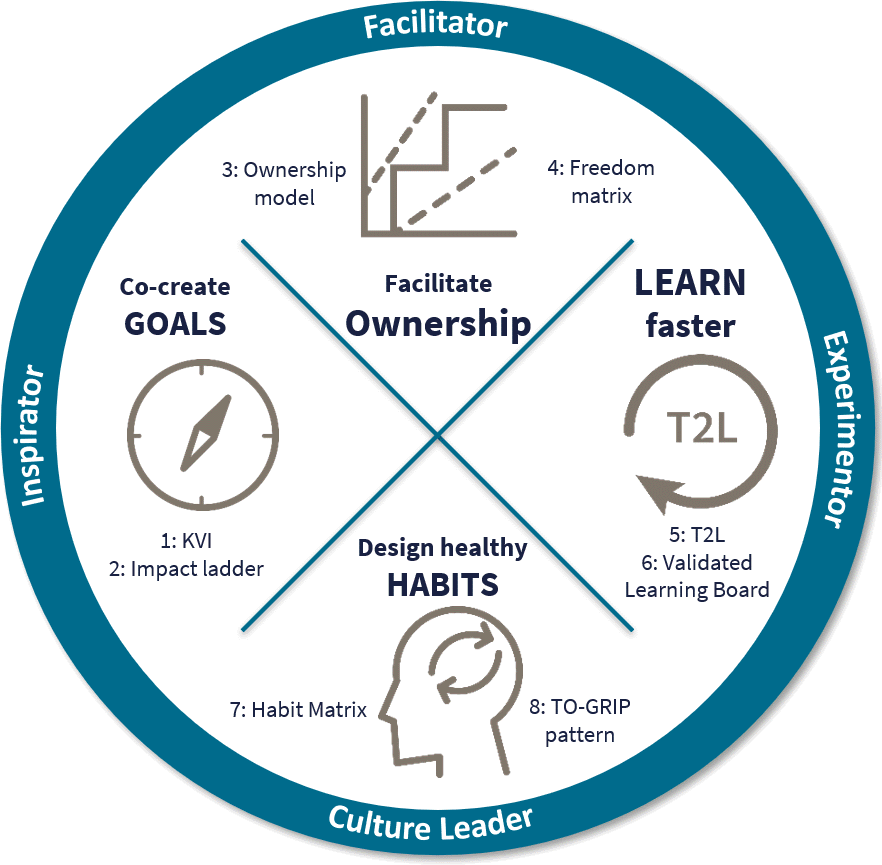
The steering wheel of the agile leader consists of four components. Each component consists of two practical tools. So in total eight tools. The tools are explained in such a way that leaders can immediately start working on this. The tools can be used separately and as such successful. Of course, all tools together – the toolkit – reinforce each other. It concerns the following eight tools:- KVI – the Key Value Indicator (KVI) is the most important indicator for value creation for the team.
- Impact ladder – for brainstorming and visualizing the customer impact. This helps teams continuously improve their products and services.
- Ownership model – visualizes what teams need to take ownership.
- Freedom matrix – what freedoms and responsibilities does the team have at what time.
- T2L – to measure the business agility.
- Validated Learning Board (VLB) – to visually keep track of the learning process of the team.
- Habit matrix – to support culture change and the design of new habits.
- TO-GRIP – to support the agile leader in implementing major improvements.


